
Obama Poll Watch -- September, 2016
Obama Hitting New Plateau?
After August's spectacular improvement in job approval polling, Barack Obama saw his numbers fall in September -- what the stock market might call a "correction." Obama had the best August he's ever had in terms of improving his poll numbers, but it seems now that the whole month was the high end of a slow, two-month cycle which might indicate he's hitting a plateau. That's all a very polite way of saying Obama's numbers went down in September, although not as much as they had risen in August. Let's take a look at his new chart.
[Click on graph to see larger-scale version.]
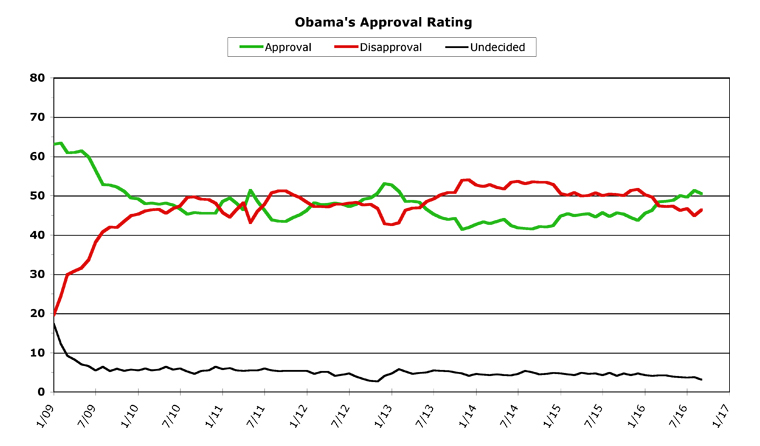
September, 2016
Obama's average monthly job approval rating rose 1.7 points in August, but then fell back 0.8 points in September, to wind up at 50.5 percent. His disapproval number fared even worse -- after falling 1.8 points in August, it rose 1.5 points in September to close at 46.4 percent. So while Obama's losses were fairly large for a single month, in perspective they are really nothing more than the end of a bounce.
September's political news almost exclusively centered around the presidential race between Donald Trump and Hillary Clinton, of course. The back-and-forth between the two has reached epic levels, culminating in the first presidential debate at the end of the month. Trump looked like he was closing the polling gap with Hillary for a while there, but after his laughable debate performance, Hillary has roared back (one national poll just put her up by 10 points). Heading into the final month, Clinton has the edge, although things are still close enough that they could shift back again quickly.
Obama wasn't in the news much at all last month, even though he had his first veto overridden by Congress. The whole thing was somewhat of a fiasco -- for Congress, that is. They passed a bill over Obama's veto and then tried to blame Obama for how badly the bill was written. No, really! They're even now promising to return after the election and fix the bill to address Obama's concerns (the reasons why he vetoed it in the first place). That doesn't exactly count as a political loss for Obama, to put it mildly, it just shows how incompetent the Republicans running both houses of Capitol Hill truly are. But, in the end, the public wasn't even paying much attention, what with all the campaign news flooding the airwaves.
This dynamic will continue throughout October, barring any unforeseen events (or should I say "surprises"?). Obama will be in the background of the political news, as the election fever hits its highest pitch. We've got two more debates to go, and then the homestretch of campaigning before the election (finally!) happens. My guess is that most of this won't even affect Obama's job approval polling much, if at all. Which is why I'm thinking the graph is going to flatten out somewhat over the next two months. But I'm getting ahead of myself, here.
Overall Trends
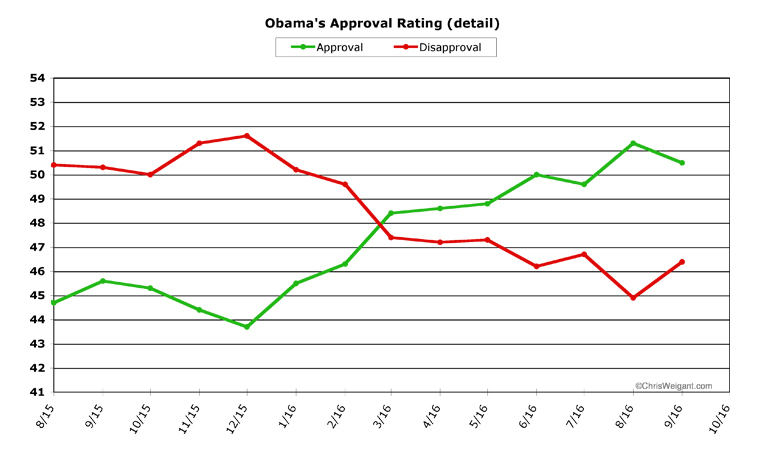
What essentially happened in September is that Obama's post-convention bounce wore off to a certain degree. Throughout August, Obama rode this bounce, but then it fell back a bit in September. Let's take a detailed look at the past year for Obama, where the differences are more easily seen.
[Click on graph to see larger-scale version.]
For the past four months, the trend for Obama's approval seems to be two steps forward, one step back. A large gain is made, but then it is tempered by a smaller loss the next month. The overall trend goes up, but in fits and starts.
There were two interesting bits of data last month worth mentioning, before I get to the overall trend. The first is that Obama's approval rating did better than his disapproval rating. After rising 1.7 points in August, Obama's approval fell only 0.8 percent last month -- less than half of the gain he had just made. But his disapproval rating didn't follow this pattern, first falling 1.8 points but then rising back 1.5 points last month -- almost as big a gain as the previous month's fall.
This brings up the second interesting bit of data. In the larger graph at the top of the column, there is a third line: undecided. The undecided number usually fluctuates from around 4.0 to 6.0 percent. The past five months, however, it has been below 4.0 percent, and it hit a low of 3.1 percent last month. This is the lowest it has been for Obama's entire second term. What happens is that the public pays more attention around the election, which means fewer people don't have an opinion. Obama's undecided number is now lower than it has been for his entire presidency, except for two months: October (2.8 percent) and November (2.7 percent) of 2012. So in large part the difference between the changes in Obama's approval and disapproval are due to more people paying attention, as they always do just before an election.
At the end of last month's column, I predicted Obama's numbers might plateau for a few months, and I still tend to believe this might be the larger trend here. Technically, I am not supposed to know what will happen in October when I write September's column, but we're already almost a week in -- and Obama's job approval ratings are once again rising quickly. But -- at least until the election's over -- I think there's a built-in ceiling to this rise. I think Obama's approval numbers will hover in the range between 50 and 52 percent, and his disapproval will likewise keep within the range of 45 to 47 percent.
Barack Obama's overall job approval chart, for both terms, has shown long periods of plateaus, interspersed with periods of frantic (or not-so-frantic) movement. He's had more big flat spots on his graph than peaks or valleys, to put this another way. I think the next two months will bear this out, and Obama will say above 50 percent (but not much above it) until the election's over. At that point, traditionally, lame-duck presidential ratings usually spike upwards, since everyone's thinking about the new president and is more willing to give the outgoing president the benefit of the doubt. So Obama could finish his second term with job approval as high as 55 or even 60 percent (indeed, he's at or above 55 percent in some individual polls already).
Congress is already out on the campaign trail themselves, so no big legislative crises loom for Obama. He'll be campaigning for Hillary, and he'll quite likely be in the news for the coming week, supervising disaster relief from the incoming hurricane. This did him wonders in 2012 with the Sandy storm, but he's also not on the ballot this time around, so people will be paying less attention. My prediction is that Obama's job approval will bounce back in October, continuing the last few months' fluctuation pattern. At the same time, I'd be surprised if his job approval average topped 52 percent. Still, this bodes well for Clinton, since presidents with good approval ratings usually see their party retain the White House in November. It also bears mentioning that if Obama does plateau at roughly 51 percent approval, it will be the highest plateau he will have ever achieved during his entire term in office (ignoring the "honeymoon" period during his first year, that is).
One final note to close on, for regular readers. While preparing this month's charts, it really struck home how few months Obama has left in his term. There will only be four more Obama Poll Watch columns, to put this another way. When I started this series, the graphs had very little data and a whole lot of white space on the right side. The empty spaces are almost full, though, meaning the column series is almost at its end. So I'd just like to take a minute to thank everyone for continuing to poll-watch with me, because it certainly has been an interesting ride.
[Obama Poll Watch Data:]
Sources And Methodology
ObamaPollWatch.com is an admittedly amateur effort, but we do try to stay professional when it comes to revealing our sources and methodology. All our source data comes from RealClearPolitics.com; specifically from their daily presidential approval ratings "poll of polls" graphic page. We take their daily numbers, log them, and then average each month's data into a single number -- which is then shown on our monthly charts here (a "poll of polls of polls," if you will...). You can read a much-more detailed explanation of our source data and methodology on our "About Obama Poll Watch" page, if you're interested.
Questions or comments? Use the Email Chris page to drop me a private note.
Obama's Second Term Statistical Records
Monthly
Highest Monthly Approval -- 1/13 -- 52.7%
Lowest Monthly Approval -- 11/13 -- 41.4%
Highest Monthly Disapproval -- 12/13 -- 54.0%
Lowest Monthly Disapproval -- 1/13 -- 42.6%
Daily
Highest Daily Approval -- 1/31/13 -- 52.5%
Lowest Daily Approval -- 12/2/13 -- 39.8%
Highest Daily Disapproval -- 12/2/13 -- 55.9%
Lowest Daily Disapproval -- 2/24/13 -- 42.3%
Obama's Second Term Raw Monthly Data
[All-time high in bold, all-time low underlined.]
Month -- (Approval / Disapproval / Undecided)
09/16 -- 50.5 / 46.4 / 3.1
08/16 -- 51.3 / 44.9 / 3.8
07/16 -- 49.6 / 46.7 / 3.7
06/16 -- 50.0 / 46.2 / 3.8
05/16 -- 48.8 / 47.3 / 3.9
04/16 -- 48.6 / 47.2 / 4.2
03/16 -- 48.4 / 47.4 / 4.2
02/16 -- 46.3 / 49.6 / 4.1
01/16 -- 45.5 / 50.2 / 4.3
12/15 -- 43.7 / 51.6 / 4.7
11/15 -- 44.4 / 51.3 / 4.3
10/15 -- 45.3 / 50.0 / 4.7
09/15 -- 45.6 / 50.3 / 4.1
08/15 -- 44.7 / 50.4 / 4.9
07/15 -- 45.7 / 50.0 / 4.3
06/15 -- 44.6 / 50.7 / 4.7
05/15 -- 45.4 / 50.0 / 4.6
04/15 -- 45.2 / 49.9 / 4.9
03/15 -- 44.9 / 50.8 / 4.3
02/15 -- 45.4 / 50.1 / 4.5
01/15 -- 44.8 / 50.5 / 4.7
12/14 -- 42.4 / 52.8 / 4.8
11/14 -- 42.0 / 53.4 / 4.6
10/14 -- 42.1 / 53.4 / 4.5
09/14 -- 41.5 / 53.5 / 5.0
08/14 -- 41.6 / 53.0 / 5.4
07/14 -- 41.8 / 53.6 / 4.6
06/14 -- 42.4 / 53.4 / 4.2
05/14 -- 44.0 / 51.7 / 4.3
04/14 -- 43.4 / 52.1 / 4.5
03/14 -- 42.9 / 52.8 / 4.3
02/14 -- 43.3 / 52.3 / 4.4
01/14 -- 42.7 / 52.7 / 4.6
12/13 -- 41.9 / 54.0 / 4.1
11/13 -- 41.4 / 53.9 / 4.7
10/13 -- 44.2 / 50.8 / 5.0
09/13 -- 43.9 / 50.8 / 5.3
08/13 -- 44.4 / 50.2 / 5.4
07/13 -- 45.3 / 49.2 / 5.5
06/13 -- 46.5 / 48.5 / 5.0
05/13 -- 48.3 / 46.9 / 4.8
04/13 -- 48.6 / 46.8 / 4.6
03/13 -- 48.5 / 46.3 / 5.2
02/13 -- 51.1 / 43.1 / 5.9
01/13 -- 52.7 / 42.6 / 4.7
Second Term Column Archives
[Aug 16], [Jul 16], [Jun 16], [May 16], [Apr 16], [Mar 16], [Feb 16], [Jan 16], [Dec 15], [Nov 15], [Oct 15], [Sep 15], [Aug 15], [Jul 15], [Jun 15], [May 15], [Apr 15], [Mar 15], [Feb 15], [Jan 15], [Dec 14], [Nov 14], [Oct 14], [Sep 14], [Aug 14], [Jul 14], [Jun 14], [May 14], [Apr 14], [Mar 14], [Feb 14], [Jan 14], Dec 13], [Nov 13], [Oct 13], Sep 13], [Aug 13], [Jul 13], [Jun 13], [May 13], [Apr 13], [Mar 13], [Feb 13], [Jan 13]
First Term Data
To save space, the only data and statistics listed above are from Obama's second term. If you'd like to see the data and stats from Obama's first term, including a list of links to the full archives of the Obama Poll Watch column for the first term, we've set up an Obama Poll Watch First Term Data page, for those still interested.
-- Chris Weigant
Follow Chris on Twitter: @ChrisWeigant


Comments for this article are closed.