
Obama Poll Watch -- August, 2014
A mixed month
First, a program note is in order. This column is woefully late, I realize. I was on vacation for the first week of the month, and then the backlog of important issues demanded my attention earlier this week. Also, since September is already one-third over, I am not going to offer up many predictions at the end of the column, since I feel it would be cheating when I've got data to look at that I normally wouldn't. Also, because I am feeling lazy. All in all, what this means is that it's going to be a very short column this month, so my apologies. We'll be back on our normal schedule next month, I promise.
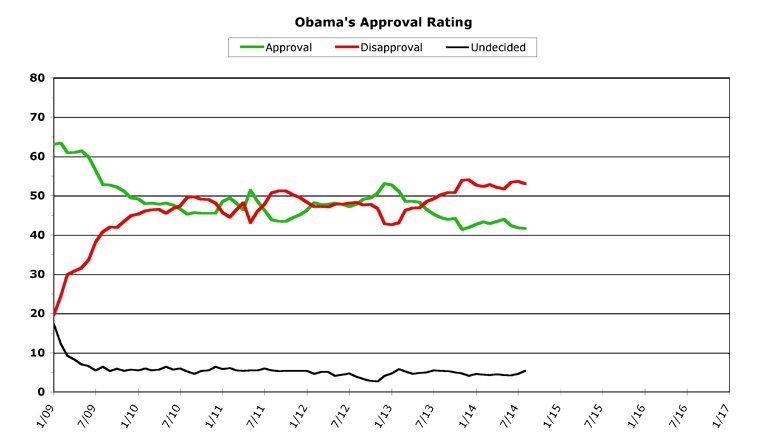
OK, with that out of the way, let's take a look at how President Obama did in job approval polling last month. The results were mixed, but overall fairly positive. Here's the new chart:
[Click on graph to see larger-scale version.]
August, 2014
August wasn't as dominated by congressional bickering, due to their taking the entire month off. The situation with children at the border eased considerably, which also drove it off the front pages and the headline news. The situations in both Ukraine and Israel had their ups and downs, but both seem to be calming down considerably -- a welcome relief.
Countering these trends, however, was the worsening situation in Iraq and Syria. The beheading of American journalists provoked a sharp response among the American public (as it was, no doubt, designed to do), and the country awoke from its "war-weary" phase to begin a wave of support for military action. Obama began airstrikes against the Islamic State (or ISIS, or ISIL) but on a limited basis. A humanitarian crisis was averted on a mountaintop, and the most important dam in Iraq was taken back from the terrorist group. The Kurds began turning the tide against the Islamic State, to the point where they were not taking new territory but actually beginning to lose ground (albeit, very slowly). Overall, it was a mixed month news-wise.
This was reflected in Obama's approval ratings. His monthly average job approval rating essentially stayed the same at 41.6 percent, falling only 0.2 percent in August (after falling 1.6 percent in June and 0.6 percent in July). But his disapproval rating showed a surprising turnaround in August, improving 0.6 percent to finish the month at 53.0 percent.
Overall Trends
Again, this is going to be a truncated view of the trends, due to the lateness of this column. President Obama's job approval stayed extremely flat in August, which bucks the general trend of Obama having pretty horrible Augusts in past years (except during his second election). Take a look at the data for past Augusts: 2009 -- 3.6 percent drop; 2010 -- 1.3 down; 2011 -- 2.4 down; 2012 -- 0.6 up; 2013 -- 0.9 down. Seen in that light, a 0.2 percent downturn isn't all that bad.
What it really represented was a flattening out of Obama's job approval, perhaps a "bottoming out" floor from which he will rise. He certainly is scraping the bottom of his own record, since he is now only 0.2 percent above the worst-ever job approval he has charted (in November of last year, during the Obamacare website disaster). In daily averages, Obama started the month at 41.6, fell briefly to 41.0 early on and then rose to 42.1 towards the end of the month. This represents movement of only 1.1 percent for the whole month -- which is an incredibly low range of movement.
The big surprise was Obama's gains in the job disapproval rating. For the month, Obama improved more than half a percent to end with a monthly average job disapproval rating of 53.0 percent, down from 53.6 percent in July. In the past two months, this number has risen 1.7 percent (June) and 0.2 percent (July), so this could signify a turnaround. The daily disapproval averages seem to reflect this as well. Obama started the month at 55.3 percent, then steadily fell to hit 51.9 percent and he finished the month at 52.0 percent. That is a lot of movement -- a range of 3.4 percent -- and the trendline was clearly in Obama's favor all month long. Obama picked up most of these gains from moving people from "disapprove" to "undecided" though. The undecided category rose to 5.4 percent (from 4.6 percent), after a very long time in the mid-to-low 4-percent range (from 4.2 to about 4.6 percent, since last December). The undecided category hasn't been this high since last August, in fact.
Overall, Obama improved the gap between approval and disapproval by 0.4 percent. This is the first such gain since May, but it still leaves him 11.4 percent "underwater," and it still leaves him with a very low approval rating heading into a congressional election season. We'll see whether Obama can improve further -- and, crucially, begin turning his approval trend around -- next month.
[Obama Poll Watch Data:]
Sources And Methodology
ObamaPollWatch.com is an admittedly amateur effort, but we do try to stay professional when it comes to revealing our sources and methodology. All our source data comes from RealClearPolitics.com; specifically from their daily presidential approval ratings "poll of polls" graphic page. We take their daily numbers, log them, and then average each month's data into a single number -- which is then shown on our monthly charts here (a "poll of polls of polls," if you will...). You can read a much-more detailed explanation of our source data and methodology on our "About Obama Poll Watch" page, if you're interested.
Questions or comments? Use the Email Chris page to drop me a private note.
Obama's Second Term Statistical Records
Monthly
Highest Monthly Approval -- 1/13 -- 52.7%
Lowest Monthly Approval -- 11/13 -- 41.4%
Highest Monthly Disapproval -- 12/13 -- 54.0%
Lowest Monthly Disapproval -- 1/13 -- 42.6%
Daily
Highest Daily Approval -- 1/31/13 -- 52.5%
Lowest Daily Approval -- 12/2/13 -- 39.8%
Highest Daily Disapproval -- 12/2/13 -- 55.9%
Lowest Daily Disapproval -- 2/24/13 -- 42.3%
Obama's Second Term Raw Monthly Data
[All-time high in bold, all-time low underlined.]
Month -- (Approval / Disapproval / Undecided)
08/14 -- 41.6 / 53.0 / 5.4
07/14 -- 41.8 / 53.6 / 4.6
06/14 -- 42.4 / 53.4 / 4.2
05/14 -- 44.0 / 51.7 / 4.3
04/14 -- 43.4 / 52.1 / 4.5
03/14 -- 42.9 / 52.8 / 4.3
02/14 -- 43.3 / 52.3 / 4.4
01/14 -- 42.7 / 52.7 / 4.6
12/13 -- 41.9 / 54.0 / 4.1
11/13 -- 41.4 / 53.9 / 4.7
10/13 -- 44.2 / 50.8 / 5.0
09/13 -- 43.9 / 50.8 / 5.3
08/13 -- 44.4 / 50.2 / 5.4
07/13 -- 45.3 / 49.2 / 5.5
06/13 -- 46.5 / 48.5 / 5.0
05/13 -- 48.3 / 46.9 / 4.8
04/13 -- 48.6 / 46.8 / 4.6
03/13 -- 48.5 / 46.3 / 5.2
02/13 -- 51.1 / 43.0 / 5.9
01/13 -- 52.7 / 42.6 / 4.7
Second Term Column Archives
[Jul 14], [Jun 14], [May 14], [Apr 14], [Mar 14], [Feb 14], [Jan 14], Dec 13], [Nov 13], [Oct 13], Sep 13], [Aug 13], [Jul 13], [Jun 13], [May 13], [Apr 13], [Mar 13], [Feb 13], [Jan 13]
First Term Data
To save space, the only data and statistics listed above are from Obama's second term. If you'd like to see the data and stats from Obama's first term, including a list of links to the full archives of the Obama Poll Watch column for the first term, we've set up an Obama Poll Watch First Term Data page, for those still interested.
-- Chris Weigant
Follow Chris on Twitter: @ChrisWeigant


Comments for this article are closed.